
Page 35 - Kỷ yếu hội thảo khoa học lần thứ 12 - Công nghệ thông tin và Ứng dụng trong các lĩnh vực (CITA 2023)
P. 35
Bao Ngoc Vi, Cao Truong Tran, Chi Cong Nguyen 19
4 Experiments
In this section, we validate the performance of EGAIN using multiple real-world da-
tasets. In the first set of experiments we quantitatively evaluate the imputation perfor-
mance of GAIN using various UCI datasets [20], which include Wine, Blood, Hepati-
tisC, Shill and iBeacon, following by the comparisons with GAIN. These are all com-
plete datasets, though to make missing datasets we randomly remove some of the data
points (MCAR). The missing rate is the percentage of data points removed. Secondly,
we evaluate the performance of EGAIN with different missing rates.The discriminator
is updated after each evolutionary step to continually provide the adaptive losses to
drive the population of generator(s) evolving to produce better solutions. Next, our net-
work and the evolutionary step are represented in detail.
We conduct each experiment 20 times and within each experiment we randomly split
data into train and test set with ratio 90:10. We report average RMSE on test set along
with their standard deviations across the 20 experiments.
4.1 Quantitative analysis of EGAIN
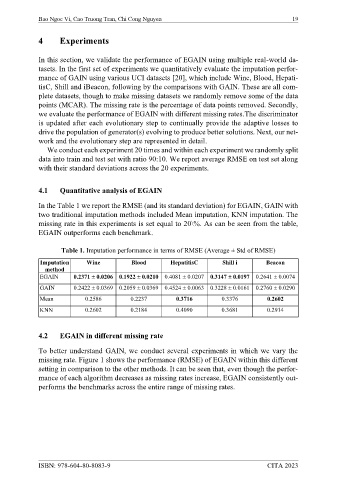
In the Table 1 we report the RMSE (and its standard deviation) for EGAIN, GAIN with
two traditional imputation methods included Mean imputation, KNN imputation. The
missing rate in this experiments is set equal to 20\%. As can be seen from the table,
EGAIN outperforms each benchmark.
Table 1. Imputation performance in terms of RMSE (Average ± Std of RMSE)
Imputation Wine Blood HepatitisC Shill i Beacon
method
EGAIN 0.2371 ± 0.0206 0.1922 ± 0.0210 0.4081 ± 0.0207 0.3147 ± 0.0197 0.2641 ± 0.0074
GAIN 0.2422 ± 0.0369 0.2059 ± 0.0369 0.4524 ± 0.0063 0.3228 ± 0.0161 0.2760 ± 0.0290
Mean 0.2586 0.2237 0.3716 0.3376 0.2602
KNN 0.2602 0.2184 0.4090 0.3681 0.2914
4.2 EGAIN in different missing rate
To better understand GAIN, we conduct several experiments in which we vary the
missing rate. Figure 1 shows the performance (RMSE) of EGAIN within this different
setting in comparison to the other methods. It can be seen that, even though the perfor-
mance of each algorithm decreases as missing rates increase, EGAIN consistently out-
performs the benchmarks across the entire range of missing rates.
ISBN: 978-604-80-8083-9 CITA 2023