
Page 181 - Kỷ yếu hội thảo khoa học lần thứ 12 - Công nghệ thông tin và Ứng dụng trong các lĩnh vực (CITA 2023)
P. 181
Tran Quy Nam and Phi Cong Huy 165
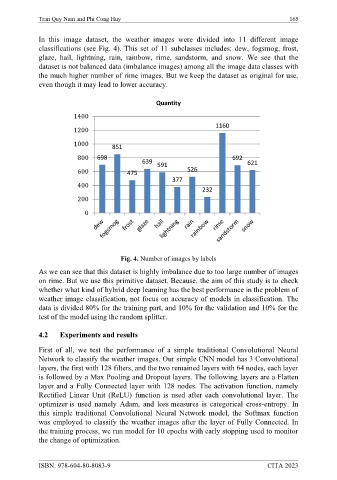
In this image dataset, the weather images were divided into 11 different image
classifications (see Fig. 4). This set of 11 subclasses includes: dew, fogsmog, frost,
glaze, hail, lightning, rain, rainbow, rime, sandstorm, and snow. We see that the
dataset is not balanced data (imbalance images) among all the image data classes with
the much higher number of rime images. But we keep the dataset as original for use,
even though it may lead to lower accuracy.
Quantity
1400
1160
1200
1000 851
800 698 692
639 591 621
600 475 526
377
400
232
200
0
Fig. 4. Number of images by labels
As we can see that this dataset is highly imbalance due to too large number of images
on rime. But we use this primitive dataset. Because, the aim of this study is to check
whether what kind of hybrid deep learning has the best performance in the problem of
weather image classification, not focus on accuracy of models in classification. The
data is divided 80% for the training part, and 10% for the validation and 10% for the
test of the model using the random splitter.
4.2 Experiments and results
First of all, we test the performance of a simple traditional Convolutional Neural
Network to classify the weather images. Our simple CNN model has 3 Convolutional
layers, the first with 128 filters, and the two remained layers with 64 nodes, each layer
is followed by a Max Pooling and Dropout layers. The following layers are a Flatten
layer and a Fully Connected layer with 128 nodes. The activation function, namely
Rectified Linear Unit (ReLU) function is used after each convolutional layer. The
optimizer is used namely Adam, and loss measures is categorical cross-entropy. In
this simple traditional Convolutional Neural Network model, the Softmax function
was employed to classify the weather images after the layer of Fully Connected. In
the training process, we run model for 10 epochs with early stopping used to monitor
the change of optimization.
ISBN: 978-604-80-8083-9 CITA 2023