
Page 23 - Kỷ yếu hội thảo khoa học lần thứ 12 - Công nghệ thông tin và Ứng dụng trong các lĩnh vực (CITA 2023)
P. 23
Van Vy and Hyungchul Yoon 7
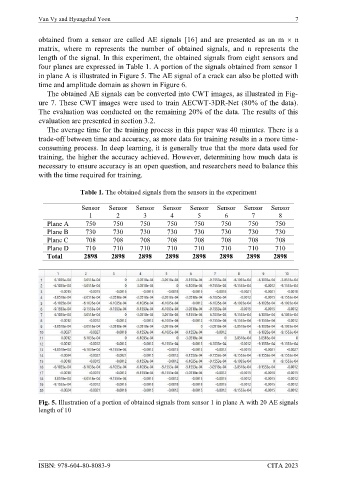
obtained from a sensor are called AE signals [16] and are presented as an m n
matrix, where m represents the number of obtained signals, and n represents the
length of the signal. In this experiment, the obtained signals from eight sensors and
four planes are expressed in Table 1. A portion of the signals obtained from sensor 1
in plane A is illustrated in Figure 5. The AE signal of a crack can also be plotted with
time and amplitude domain as shown in Figure 6.
The obtained AE signals can be converted into CWT images, as illustrated in Fig-
ure 7. These CWT images were used to train AECWT-3DR-Net (80% of the data).
The evaluation was conducted on the remaining 20% of the data. The results of this
evaluation are presented in section 3.2.
The average time for the training process in this paper was 40 minutes. There is a
trade-off between time and accuracy, as more data for training results in a more time-
consuming process. In deep learning, it is generally true that the more data used for
training, the higher the accuracy achieved. However, determining how much data is
necessary to ensure accuracy is an open question, and researchers need to balance this
with the time required for training.
Table 1. The obtained signals from the sensors in the experiment
Sensor Sensor Sensor Sensor Sensor Sensor Sensor Sensor
1 2 3 4 5 6 7 8
Plane A 750 750 750 750 750 750 750 750
Plane B 730 730 730 730 730 730 730 730
Plane C 708 708 708 708 708 708 708 708
Plane D 710 710 710 710 710 710 710 710
Total 2898 2898 2898 2898 2898 2898 2898 2898
Fig. 5. Illustration of a portion of obtained signals from sensor 1 in plane A with 20 AE signals
length of 10
ISBN: 978-604-80-8083-9 CITA 2023