
Page 45 - Kỷ yếu hội thảo khoa học lần thứ 12 - Công nghệ thông tin và Ứng dụng trong các lĩnh vực (CITA 2023)
P. 45
Dinh-Hoang-Long Tran, Quoc-Huy Le 29
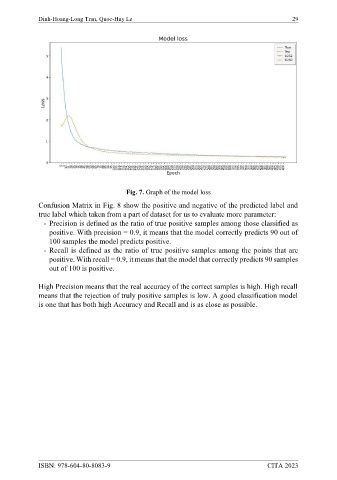
Fig. 7. Graph of the model loss
Confusion Matrix in Fig. 8 show the positive and negative of the predicted label and
true label which taken from a part of dataset for us to evaluate more parameter:
- Precision is defined as the ratio of true positive samples among those classified as
positive. With precision = 0.9, it means that the model correctly predicts 90 out of
100 samples the model predicts positive.
- Recall is defined as the ratio of true positive samples among the points that are
positive. With recall = 0.9, it means that the model that correctly predicts 90 samples
out of 100 is positive.
High Precision means that the real accuracy of the correct samples is high. High recall
means that the rejection of truly positive samples is low. A good classification model
is one that has both high Accuracy and Recall and is as close as possible.
ISBN: 978-604-80-8083-9 CITA 2023