
Page 265 - Kỷ yếu hội thảo khoa học lần thứ 12 - Công nghệ thông tin và Ứng dụng trong các lĩnh vực (CITA 2023)
P. 265
Thi-Thuy-Trinh Tran, Thi-Thanh-Minh Dang, Phuoc-Cuu-Long Le and Thi-Thu-Huong Dao 249
4 Research Results
4.1 Data Descriptive Statistics
With 310 samples in the data analysis, 144 males (46.5%) and 166 females (53.5%)
participated in the survey. Regarding the University that students are attending, VKU
students accounted for the most with 26.5%, the second was DUE students with
19.7%, and the third place was UTE with 12.3%. Regarding the year students attend,
39% are currently a sophomore, 20% are a freshman, 17.7% are fourth-year students,
17.1% are third-year students, and finally, 6.1% of students are in their Fifth year.
Regarding majors, 49.7% of students majoring in Social science, 19% of students
studying Science, engineering, and technology, 17.4% of students studying Natural
Sciences, 8.1% of students studying Medical and pharmaceutical sciences, and 5.8%
studying Humanities. Regarding time users use social networks in a day, the authors
divided into four groups: Less than 1 hour accounted for 15.2%; From 1-2 hours ac-
counted for 24.2%; From 2-3 hours accounted for 22.6%, and over 3 hours accounted
for 38.1%.
4.2 Reliability Test Results
According to Cronbach's Alpha reliability test findings, all 22 observable variables of
the four groups: Social media experiences (SME), Attitude toward Social Media
Website (ASM), Attitude towards the University brand (AB), and eWOM have a
Corrected item-total Correlation higher than 0.30. All scales have a Cronbach's Alpha
coefficient better than 0.60. Thus, these scales assure dependability.
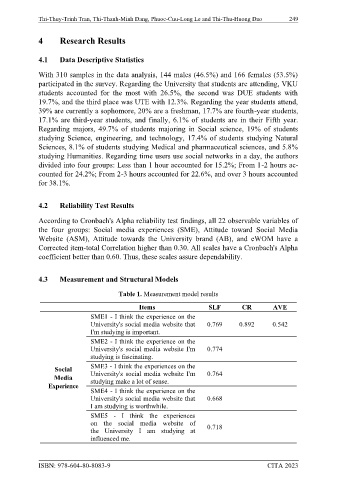
4.3 Measurement and Structural Models
Table 1. Measurement model results
Items SLF CR AVE
SME1 - I think the experience on the
University's social media website that 0.769 0.892 0.542
I'm studying is important.
SME2 - I think the experience on the
University's social media website I'm 0.774
studying is fascinating.
Social SME3 - I think the experiences on the
Media University's social media website I'm 0.764
studying make a lot of sense.
Experience
SME4 - I think the experience on the
University's social media website that 0.668
I am studying is worthwhile.
SME5 - I think the experiences
on the social media website of 0.718
the University I am studying at
influenced me.
ISBN: 978-604-80-8083-9 CITA 2023