
Page 254 - Kỷ yếu hội thảo khoa học lần thứ 12 - Công nghệ thông tin và Ứng dụng trong các lĩnh vực (CITA 2023)
P. 254
238
IM1 3.9100 .336 .760 .
IM2 3.9100 .303 .760 .
Purchase Intention (PI) = 0.831 (N=3)
PI1 7.2167 3.087 .623 .828
PI2 7.5133 2.518 .769 .683
PI3 7.5500 2.676 .684 .772
4.3 Exploratory Factor Analysis (EFA) Results
The results achieved KMO coefficient = 0.766> 0.5 and Barlett's test value with a
significance level Sig = 0.000 <0.05, indicating that these 23 observations were
correlated and entirely consistent with the factor analysis.
Besides, the results showed that 23 items are grouped into seven factors. The total
variance extracted is 64.383%> 50%, showing that seven factors explain 64.383% of
the variation of the data set, and the Eigenvalues are 4.797; 2.953; 2.646; 2.283; 2.016;
1.386, and 1.123, respectively, and they are all higher than 1 qualifies for factor
analysis.
4.4 Research Model Testing
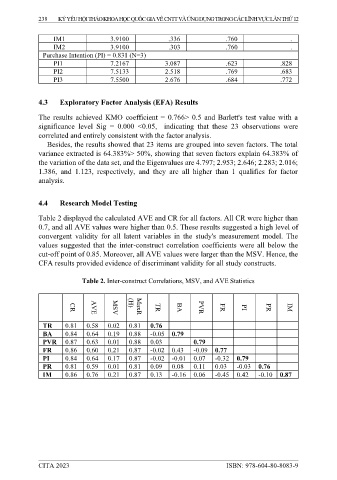
Table 2 displayed the calculated AVE and CR for all factors. All CR were higher than
0.7, and all AVE values were higher than 0.5. These results suggested a high level of
convergent validity for all latent variables in the study's measurement model. The
values suggested that the inter-construct correlation coefficients were all below the
cut-off point of 0.85. Moreover, all AVE values were larger than the MSV. Hence, the
CFA results provided evidence of discriminant validity for all study constructs.
Table 2. Inter-construct Correlations, MSV, and AVE Statistics
CR AVE MSV (H) MaxR TR BA PVR FR PI PR IM
TR 0.81 0.58 0.02 0.81 0.76
BA 0.84 0.64 0.19 0.88 -0.05 0.79
PVR 0.87 0.63 0.01 0.88 0.03 0.79
FR 0.86 0.60 0.21 0.87 -0.02 0.43 -0.09 0.77
PI 0.84 0.64 0.17 0.87 -0.02 -0.01 0.07 -0.32 0.79
PR 0.81 0.59 0.01 0.81 0.09 0.08 0.11 0.03 -0.03 0.76
IM 0.86 0.76 0.21 0.87 0.13 -0.16 0.06 -0.45 0.42 -0.10 0.87
CITA 2023 ISBN: 978-604-80-8083-9