
Page 243 - Kỷ yếu hội thảo khoa học lần thứ 12 - Công nghệ thông tin và Ứng dụng trong các lĩnh vực (CITA 2023)
P. 243
Nguyen Van Thanh Vinh, Nguyen Dang Nha, Le Kim Hoang Trung and Nguyen Thanh Tuan 227
Fig. 4. Using QGIS to build GeoJSON
Furthermore, we use photo scanning from popular GIS servers to collect data and
display it on the map, enabling users to easily locate and view each building. Addi-
tionally, we created a heat map feature to facilitate optimal position assistance in the
event of incidents such as fires, electrical faults, or overloaded areas, providing users
with a sense of the level of each area on the map.
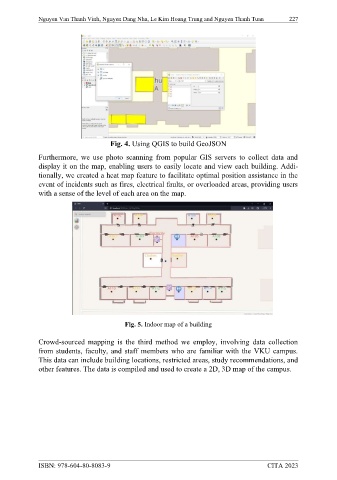
Fig. 5. Indoor map of a building
Crowd-sourced mapping is the third method we employ, involving data collection
from students, faculty, and staff members who are familiar with the VKU campus.
This data can include building locations, restricted areas, study recommendations, and
other features. The data is compiled and used to create a 2D, 3D map of the campus.
ISBN: 978-604-80-8083-9 CITA 2023